WASM - Setting up the debugging environment
To exploit WebAsembly, we need a way to inspect it’s variables, and memory while it runs. If you look this up, you will see two articles coming up over and over again.
Debugging WebAssembly with modern tools
The Pain of Debugging WebAssembly
So is it easy to debug WebAssembly with modern tools, or is it a pain? In reality, very few people actually use this technology, and there is not a high demand for debugging tools. In fact the only avaliable option for the time being seems to be this extension for chromium:
C/C++ DevTools Support (DWARF)
You’ll also want to enable WebAssembly debugging in the DevTools Experiments. Open Chrome DevTools, click the gear (⚙) icon in the top right corner of DevTools pane, go to the Experiments panel and tick WebAssembly Debugging: Enable DWARF support.
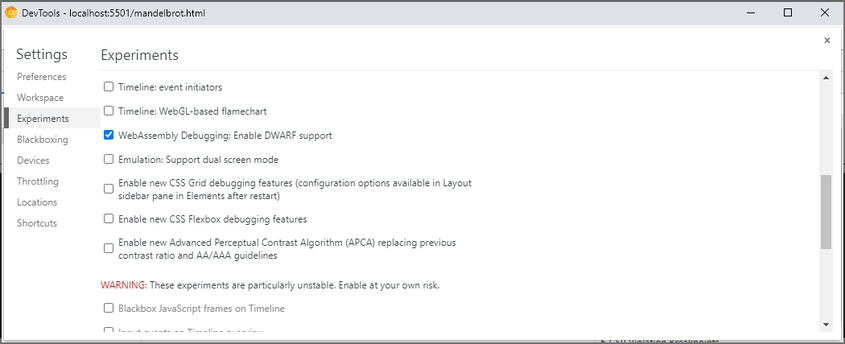
Restart chromium after this, the extension is not working unless it shows up in a nice purple color.
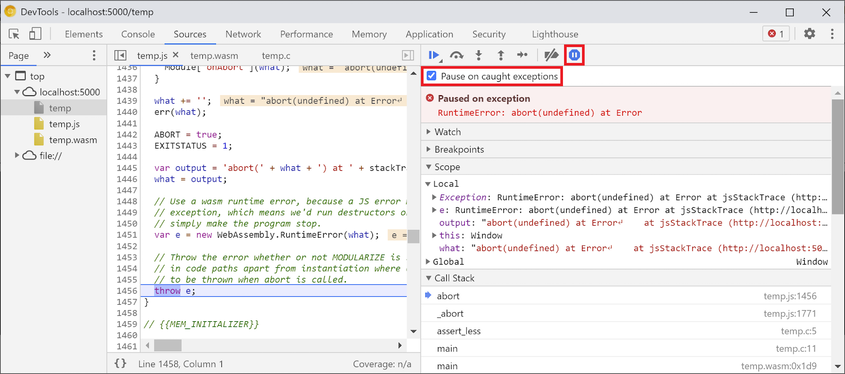
To use this extension you will have to open the developer tools, go to sources, pause execution, and then find your .c file in the call stack. To see it, you’ll have to compile your binary with the -g option, and you will need the extension to be active.
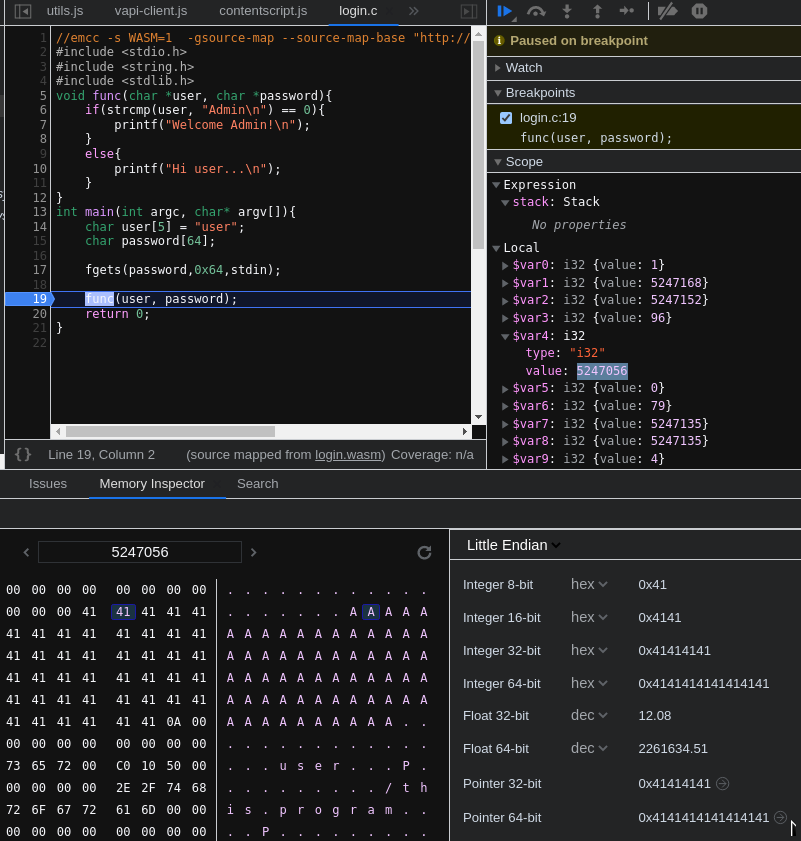
You can open the memory inspector, if you find a variable in scope, that is actually stored in linear memory. If it is, you will get an option to “Open in memory inspectior window”. Your best bet are strings for this.
“But wait!” - I hear you say - “All of this only works with .c files? I thought you can make WASM binaries from golang, Rust and other languages too!”. Well yes, however those languages are memory safe, so there’s not much of a point in trying to exploit them. This, of course, also means, that your hacking options are reduced to only a small section of what is already a very niche software stack.
As an added bit of complexity, this debugging tool fails to resolve variable names if the source-map is hosted on the webserver (i.e.: this CTF), instead of the local filesystem. You can bypass this problem by either downloading the source files and recompiling them locally with the -g option, which is a hassle. Alternatively you can use the variables as they are, their values are mostly just an offset in memory, which you can copy in the memory inspectior.
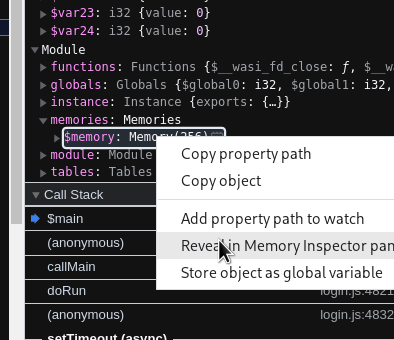
You can reveal that memory inspector panel by right-clicking on the memory space under “Module”.
Before going to the tasks, please read this, it will help a lot.
Sidenote: The tasks are all compiled with emscripten, which takes input in a popup window before the task starts. After sending in your input, it will pop up again until you press cancel. To use it correctly, you’ll need to enter your input in the first popup, and cancel the second one.